This expression arose from the time when ordinary homeowners realised that their home did not have value simply as somewhere to live, but also as an investment. It became evident that constantly increasing property values, reflected in house prices, provided, over the long term, a better return on capital than savings accounts, and at the same time a place to live. Paying rent when you could be paying off a mortgage did not make sense to most people.
The mortgage lenders were eager to oblige, and with the demutualisation of building societies in the 1980s the banks were more involved. Lending grew enormously, became overextended, and led eventually to the financial collapse of 2007–8. It was all based on the hope that house prices would go on rising forever, and everyone wanted to be a beneficiary. But the rising house prices were caused by an increasing demand for a scarce commodity––in the right locations; in the wrong locations prices barely moved. In either case there was no increase of real wealth. Josh Ryan-Collins et al. describe the events of this period of rapid mortgage lending as the ‘financialisation’ of land.1
The figures of Table 3 have been compiled from data on the Design Laboratory website, which gives comparative values of average annual wages, cars and houses from 1900 to 2016. Part A shows the actual values, part B the equivalent 2019 values, adjusted for inflation.
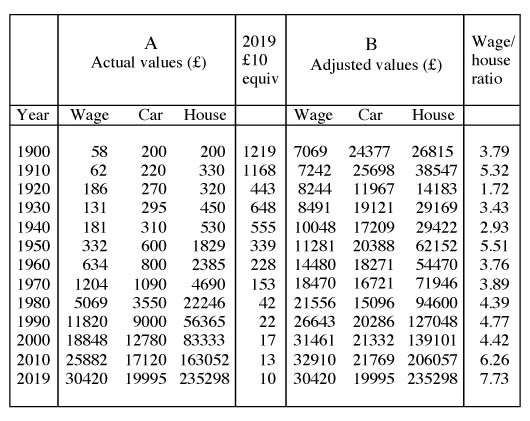
Table 3 UK average of values of annual wages, cars and houses, 1900-2019 (Source: The DesignLaboratory: http://thedesignlab.co.uk/costofliving2015/ukupdate.php?uid=36)
As can be seen, prior to World War II, adjusted house prices had risen and fallen more or less in equal measure; by 1940 the price of a house was only 9% more than in 1900. After World War II, house prices rose sharply, then stabilised for a period in the 1950s, before beginning the inexorable rise that would continue to the present time. Homeowners recognised that in the longer term their home would generally appreciate in value despite temporary declines during economic recessions. Of course, property developers had always understood the opportunities available in appreciating property values and also that land values varied according to the demand for good locations. Their success depended on their ability to make advantageous choices about where and when to buy and invest and when to sell. From 1960 onwards, their ranks were swollen by a growing number of aspiring homeowners who saw the same opportunities (see Figure 14). This is when the idea of getting on the property ladder became current.
Figure 14 shows three different types of tenure: homeownership, private renting and social renting, in the period from 1918 to 2014.
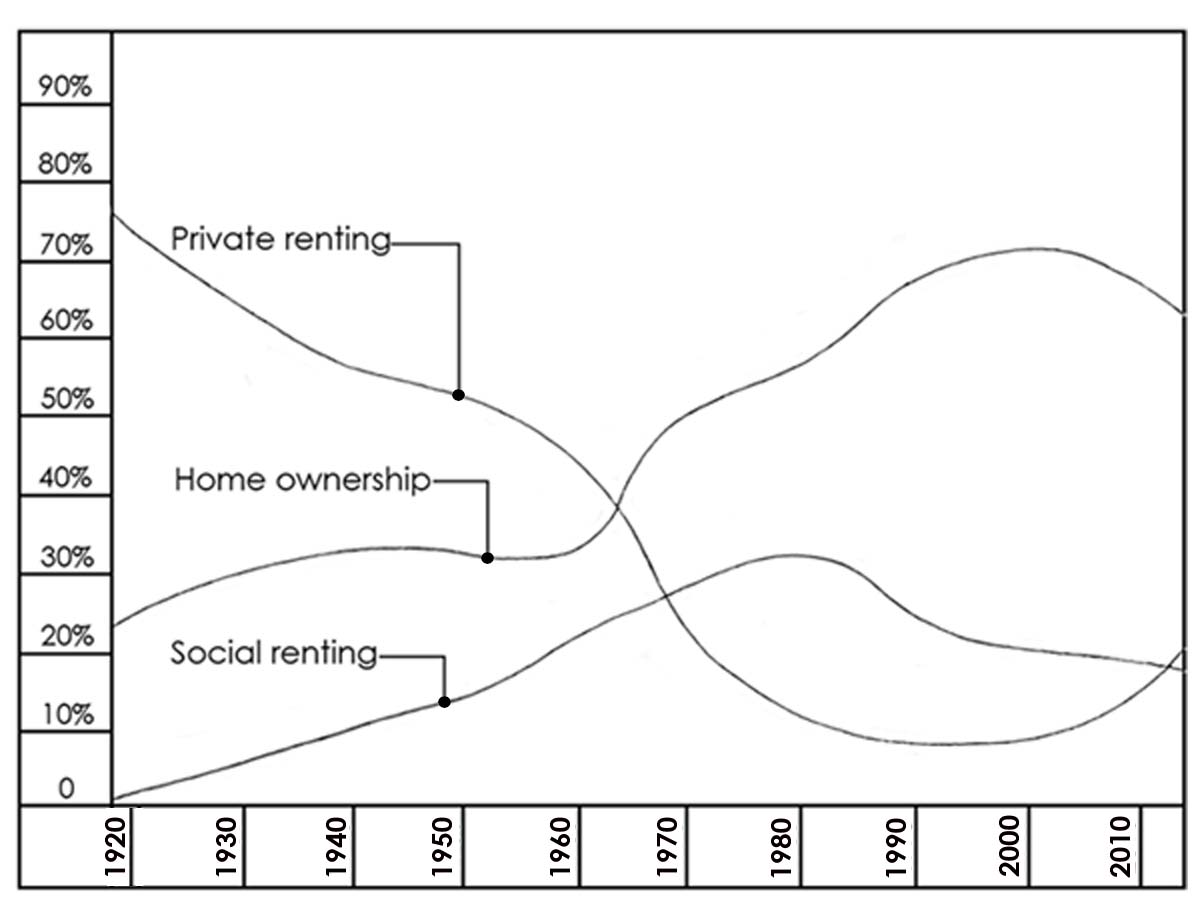
Fig. 14 Variations in tenure, 1918–2014 (Source: ONS, webarchive, National Archives)
As can be seen, with homeownership there is a sudden increase from the 1960s onwards, peaking around the year 2000. From 1918 onwards private renting declined until reaching a low-point in the 1990s, and then starting to rise again. It’s notable that these two graph lines almost mirror each other. Social renting reached a peak in the early 1980s and has been in decline ever since
It has to be borne in mind that during the period in question tenure varied considerably. In the early years the majority of people were private renters; social renting was only just becoming established, but it increased constantly after World War I, until reaching a peak in the 1980s. The trends shown could also be seen to represent the changes of influence on politicians exercised by the different social blocs through the vote. From the middle of the period, the politicians would have been more concerned with the votes to be gained from the growing number of social renters, up until the 1980s. After that their concern turned towards the interests of homeowners. In the case of homeowners (those safely on the property ladder), there was, and still is, a vested interest in constantly increasing house prices. This increase is not due to any increase in the overall wealth of the community, but merely an increase of existing asset value for the homeowners. The media, encouraged by many politicians and economists, still see any such increase as a matter for celebration. LVT would of course arrest this process and gradually reverse it, so it is likely to be opposed by the many homeowners who would see themselves as the losers in any such radical change.
The graphs of Figure 15 show comparative costs of cars and houses in relation to average wages, for the period 1900 to 2020. They are based on the figures shown in Table 3B. (The use of adjusted values are more meaningful, especially in the earlier years).
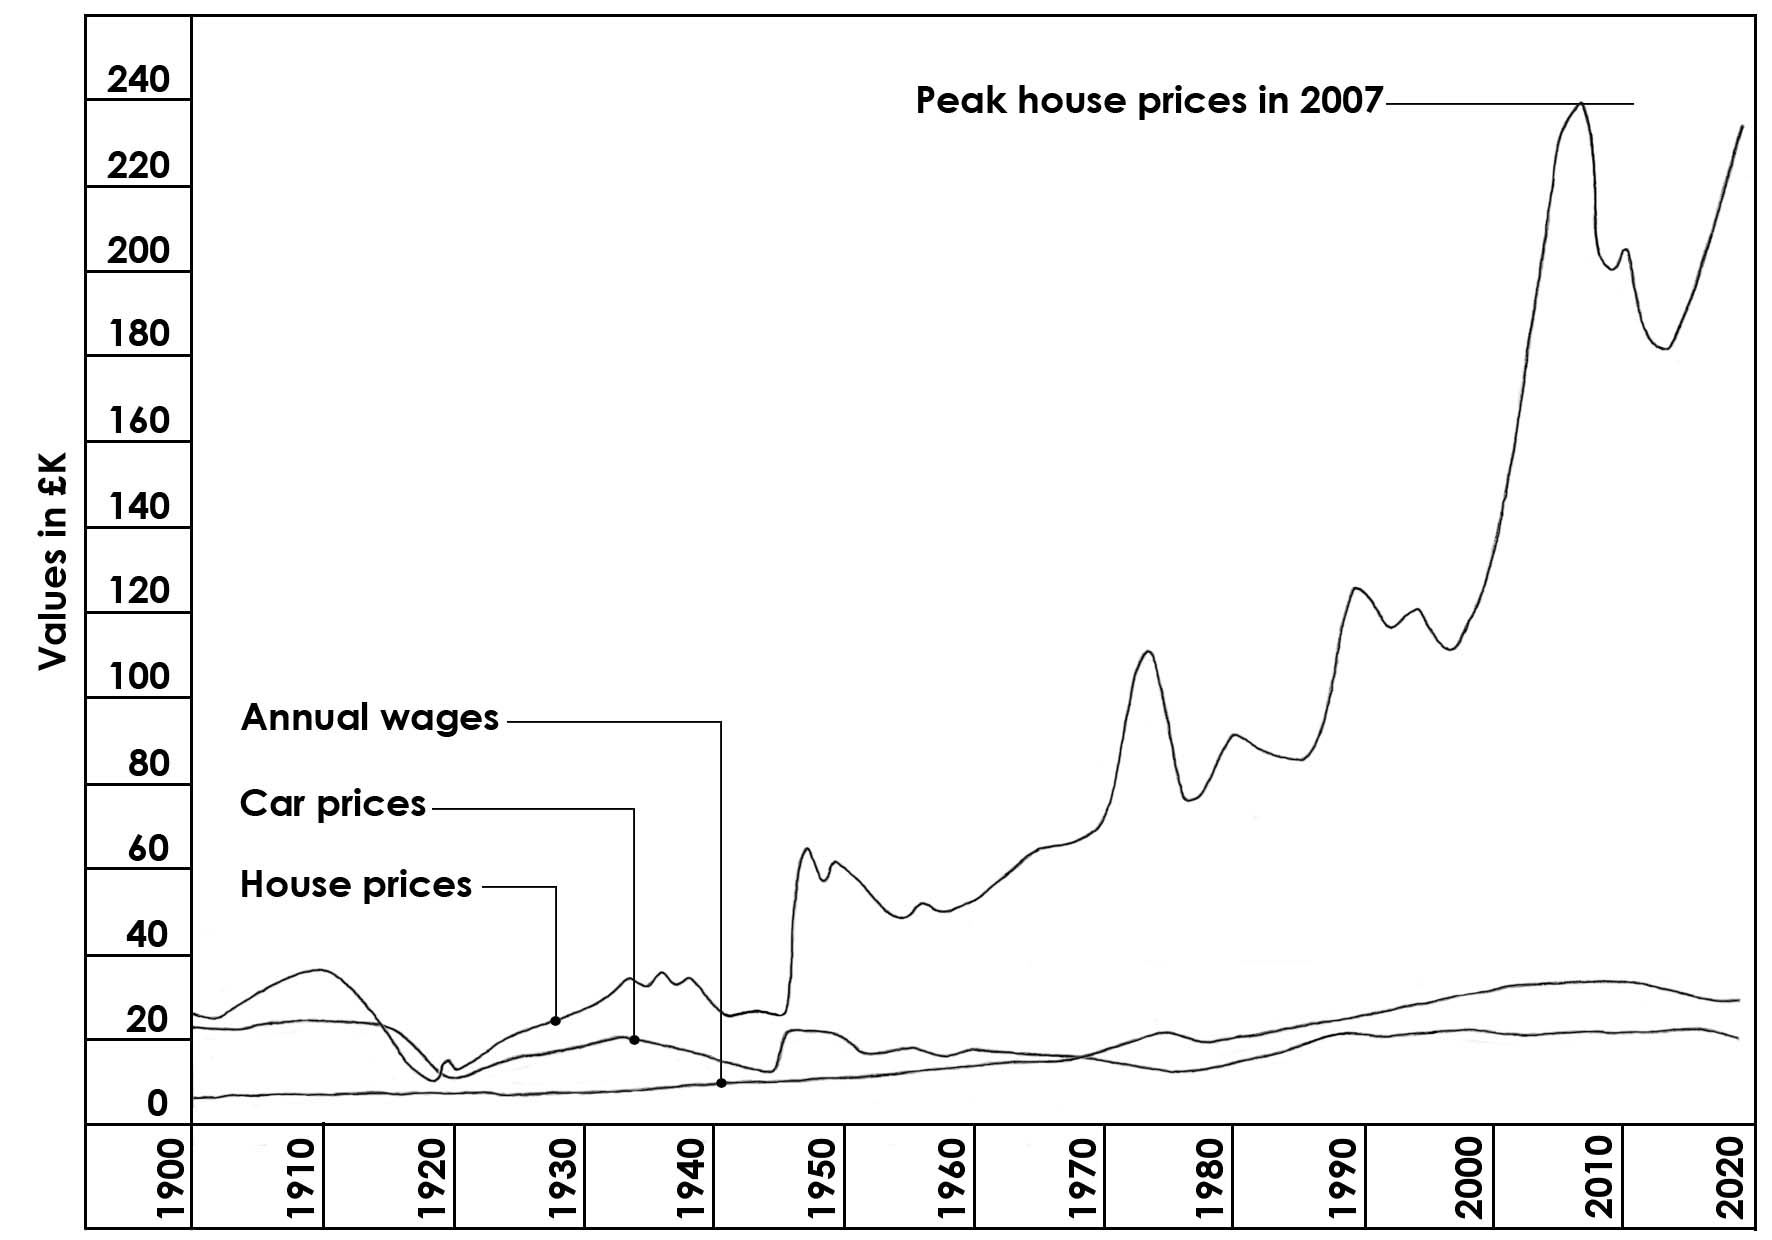
Fig. 15 Cost of living indicators: Average values in £ (adjusted) for houses, cars and annual wages; 1900 – 2016
In 1900 a house cost just under four times the annual wage, a car 3.4 times; a car was certainly a luxury. Wages rose slowly from 1900 to 1935, then more rapidly, reaching a maximum about 2008, Car prices fluctuated in the earlier decades, but stabilised after about 1952. Car prices and annual wages were about the same in 1968, after which car prices were always lower. At the end of World War ll house prices jumped from £26,536 in 1945 to £66,700 in 1947, before returning to £50,421 in 1954. Thereafter house prices continued to climb––with peaks in the 1970s and 1990s––until reaching another peak in 2007, just before the economic crash of 2008. The ratio for average wages to house prices fluctuated in the first 50 years no doubt due to distortions caused by the two wars and the 1930s depression, but the ratio in 1970 (3.89) had returned almost to what it had been in 1900 (3.79). Thereafter the ratio increased steadily until it had reached 7.26 in 2007 and 7.73 in 2019. For the younger generation, buying a home from their own resources was becoming impossible.
Private renting, which had previously been in decline, started to increase again in the 1990s. The annual minimum wage in 2019 was about £16,000, well over double the average wage in 1900, but taxes on the individual then were less onerous than in 2019. However, due to the lack of social and welfare provisions in 1900, there was a larger proportion of the working population that could be considered ‘poor’.
References:
(1) Ryan-Collins, Lloyd, Macfarlane, Rethinking the Economics of Land and Housing, p.14.