The diagrams shown below are based on the data provided by the Ministry of Housing, Communities and Local government in its publication:
‘Land Value Estimates for Policy Appraisal 2019, Guidelines for Use’
The MOHCLG is careful to point out that the data is only suitable for ‘policy appraisal’. In the introductory page it provides the following disclaimer:
‘This document contains land value estimates for policy appraisal, with residential land value estimates by local authority and average industrial and agricultural values for England. This includes an estimate of a ‘typical’ residential site in each of England’s local authorities, along with an average industrial and agricultural land value for England. Values of individual sites are highly sensitive to plot-specific characteristics and the report does not present estimates of market value. As a result, the estimates are not suitable for use other than for policy appraisal.’
Allowing for this limitation, the data is nevertheless very useful in showing the variations in values within each local authority region, and the comparative values between regions.
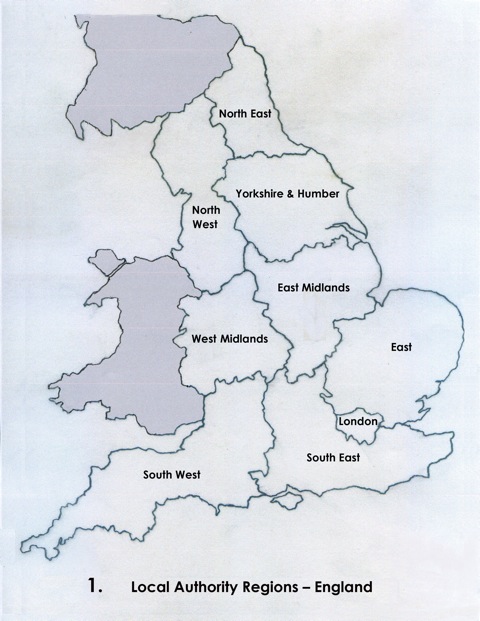
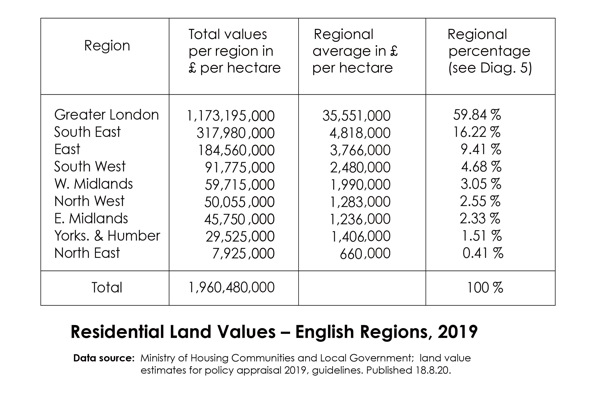
There are nine regions in England, as shown in diagram 1. Greater London is counted as a region, and although it is only a fraction of the area of any of the other regions it accounts by far for the highest values, as can be seen.
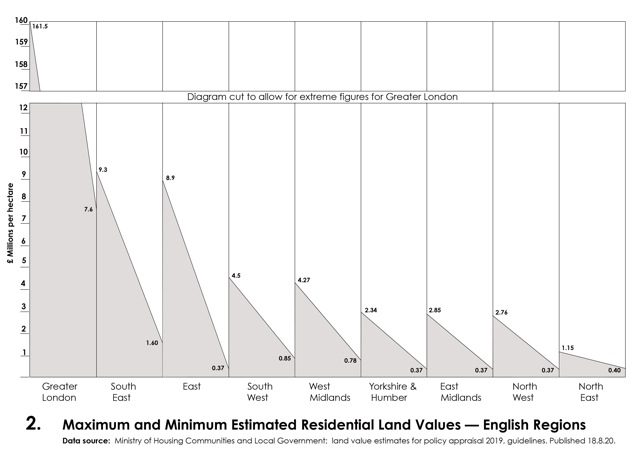
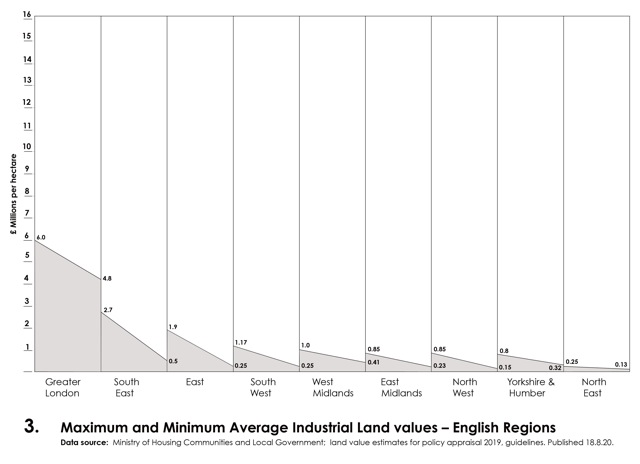
Diagrams 2 and 3 show the comparative maximum and minimum values within each region for residential and industrial values respectively.
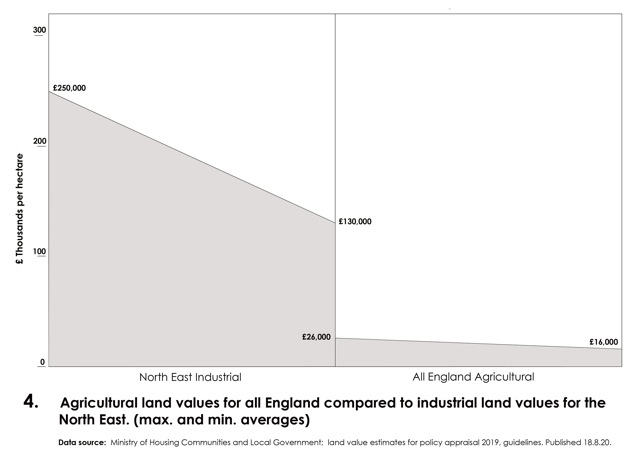
Diagram 4 has been added showing agricultural values for all of England compared with the lowest value industrial region, the North East. This clearly shows how agricultural land values are in a different lower league to all the other land use values, a point which I have emphasised earlier in the explanations. (see: Explanation Part 3, item 5, Agricultural Land Values)
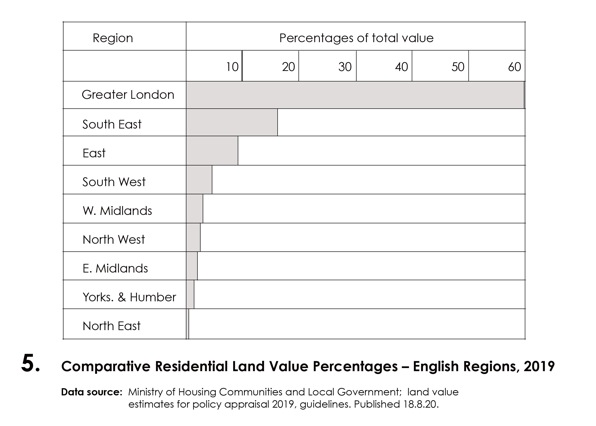
Diagram 5 is derived from the preceding table and shows the comparative land values for each region as a percentage of the total.