In the explanation of Part 2, it can be seen that LVT is predominantly an urban rather than a rural tax, in the sense that by far the greater revenue would be derived from the former. Although rural land accounts for about 87% of Britain’s total land area, it represents only about 5% of the total land value.1 This means that rural land would contribute about 5% of the total LVT and urban land about 95%.
The primary difference between urban and rural land values is that urban land values are determined by location within a close-knit agglomeration of sites, each contributing to the economic pressure that gives rise to the increase of value. This significance of location does not apply within the rural situation, where sites are at some distance from any existing economic centre, and although they may be adjacent to each other, are far too large in area and diffuse to create any economic centre due to proximity. As explained in Part 3, item 1, Causes of Land Value/Population Intensity, there is no agglomeration effect where rural land is devoted entirely to farming. Agricultural land values are slight in comparison to urban land values, especially where large cities are concerned. Also the variations in value due to location are much greater within an urban context.
The figures of Table 1 below, taken from the Valuation Office Agency Report for 2011, show the differences in values, in £ per acre, between agricultural and residential land for some typical areas in England.2
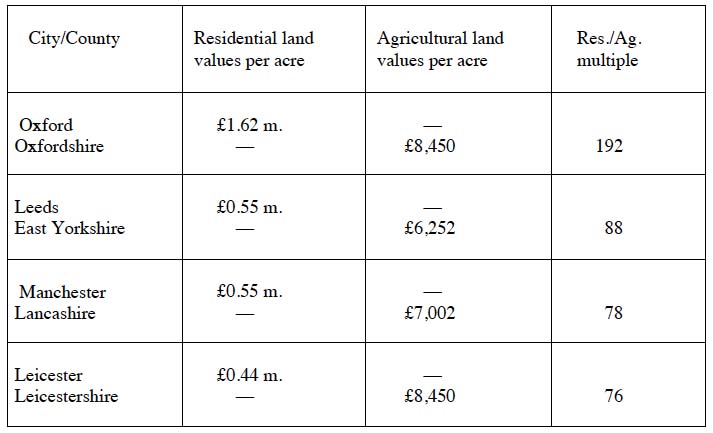
Table 1. Comparison of residential and adjacent agricultural land Values for selected cities in England, 2011 (Source: Valuation Office Agency Report for 2011)
The fourth column in the table shows a multiple indicating how much more valuable the residential land is in the cities compared to the adjacent agricultural land. It is notable that the multiple for Oxford is far higher than the other three cities. This is entirely due to the much higher residential values. The multiple for Oxford is 2.5 times higher than that for Leicester, but the Oxfordshire and Leicestershire rural values are the same. It is likely that the higher residential values in Oxford are due to their proximity to London, but the ‘London effect’ does not apply where agricultural land is concerned. Whereas urban values are determined by variations in location, agricultural values are determined mainly by variations in fertility, which are quite small by comparison. The best farmland (prime arable) is rarely more than double the price of the least valuable (poor grassland). Figures published by the estate agents Savills on farmland prices show that in 2011 the average prime arable land was selling for £7000/acre and poor grassland at £3500/acre.3
In a book on real estate investment in the US, Prof. Roger Brown presents an interesting diagram of land use rental values for a hypothetical city, in which he shows the breakdown of values and areas for different uses, ranging from commercial, light industrial, residential, heavy industrial through to agricultural.4 His diagram bears a striking resemblance to Figure 12 in Part 2, which I show again here, in Figure 13, as a linear curve with the different zones indicated in similar proportions to those in Prof. Brown’s diagram.
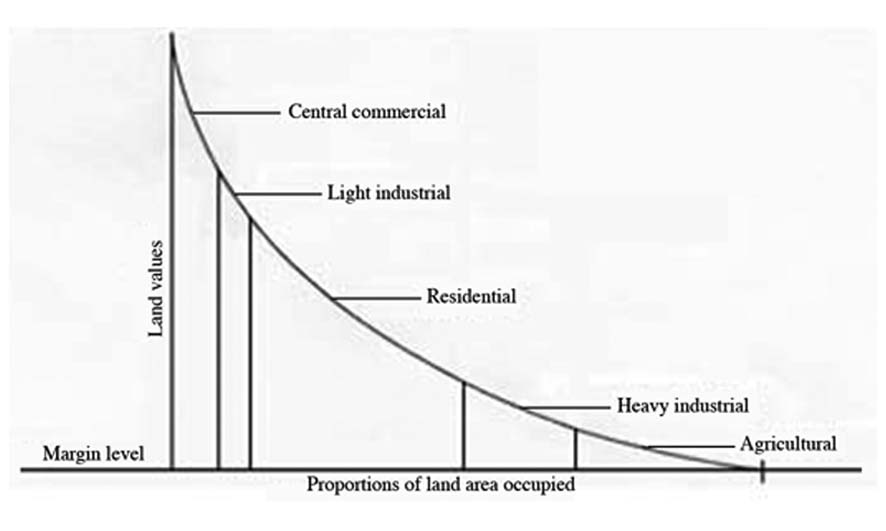 Fig. 13 Comparison of land areas and values for different uses within a typical developed city
It is notable that the largest land area is taken up by residential, and also that the agricultural zone values become marginal at the greatest distance from the centre. It is worth remembering that, where residential land is concerned, the LVT is a payment for occupation only, whereas all the other categories are for occupancy and productive use.
The diagram shows that where use values are concerned, agricultural land is always at the bottom of the hierarchy. Industrial land is always more valuable, and residential more valuable than both. In prime urban areas residential land can attain very high values. In London, in the Chelsea Barracks redevelopment scheme of 2008, the 12.8 acre site was sold for £959 million (£75 million/acre).5 In London W1, in 2019, a residential plot was being offered for sale (without planning consent), at the rate of £576 million/acre.6
The point I’m making here is that there is a vast difference between urban and rural land values where LVT revenue potential is concerned. As Table 1 shows, it would require 192 acres of Oxfordshire farmland to match the value of 1 acre of residential land in Oxford itself. In the central London example, a one-acre site would require an equivalent farm area of more than 68,000 acres.
So how might one resolve this taxation issue peculiar to rural land?
In any discussion of the economics of farming one has to take into account the subsidy system, which has been in place since World War 2. Rationing and subsidies were introduced during the war for understandable reasons during the emergency. To encourage production of food after the war, the 1947 Agriculture Act subsidised farmers in the form of price guarantees (food rationing continued until 1954). In 1973 Britain joined the European Union and came within the subsidy system of the Common Agricultural Policy (CAP). This policy encouraged all European farmers to produce more food than could be justified by the normal requirements of supply and demand and resulted in the infamous butter mountains and wine lakes.
Historically, the CAP emphasised direct subsidies for agricultural production. To reduce price distortion, the connection between subsidies and specific forms of production was removed. Instead, the Single Farm Payment was introduced in 2003, which subsidised farmers on a per hectare basis to comply with WTO agreements to reduce market-distorting subsidies and price controls. In Britain this encouraged large farmers to buy more land and gain the benefit of the increased subsidy. The policy encouraged landownership rather than food production and made life more difficult for those young would-be farmers who wanted to start farming.
Tenant farmers who receive subsidies pay most, if not all of the money to their landlords in rent. The number of tenant farmers has been in decline for decades. Rural land has become a speculative commodity, with constantly increasing land prices. This process could be reversed with the introduction of a land value tax, but it would also be necessary to eliminate the distortionary effect of subsidies. Julian Pratt notes that subsidies ‘burden the taxpayer and benefit the landowner by increasing the market rent and market value of land.’ 7 Subsidies for any industry should only be used for some short-term emergency. Where they become permanent they can only lead to a distortion of the natural economic balance.
As Britain has now left the European Union the CAP system will be replaced gradually by the provisions of the new Agriculture Act 2020 in which subsidies will continue but will be based more on environmental protection and restoration. Most of the subsidy money will still go to less than 30% of the farmers, who own about 70% of the land. The farmers will spend more of their time as park-keepers.
Introducing a land value tax in the rural situation would need to be part of a national system (as opposed to a local system) as explained in Part 2, Application of LVT. It would also need to be phased in over a transition period (of say 10 years) to avoid any disruption. The concurrent reduction of subsidies would be felt more by the small tenant farmer who in many cases has become dependent on them. The large farmer/landowner would also be affected, but only in the sense that the net worth of his land would fall. The introduction of LVT is conditional on a reduction of other taxes, which would benefit everyone in rural areas (see Part 2, Advantages of LVT). But to help the start–up tenant farmer in particular, perhaps the reduction could be applied directly as an allowance on their income tax payments, for a limited period until the situation normalised. In this way the farmer would be able to see the direct benefit to him of the change to LVT––in the way that I describe for the replacement of council tax in Part 3, item7, Winners and Losers.The small farmer would also be helped by a gradual reduction in land prices, as a consequence of LVT. The ideal would be no subsidies at all, with a fair return to the food-producing farmer, through a reduction in the costs of production and a higher return for his product.
According to the CAP Reform website 8 the farmers’ share of the final shop prices for food in 1995 was 31%; the remaining 69% was divided between retailers, wholesalers and food processors. In 2011 the share was 21%, a drop of 10% in 16 years––and the trend continues. Farmers are the basic producers on whom the industry depends; they should get a fairer share and therefore be less dependent on subsidies.
Farming has been subsidised since World War 2 and has led many farmers to a state of dependency: Not good for them or the taxpayers.
It’s worth digressing slightly here to look at how we value food compared to other necessities:
It could be said that there are only three basic necessities for human survival: food, warmth and shelter. The need for food requires no explanation. Warmth is provided through clothing and heating, in whatever form. Shelter protects us from the elements and may range from anything between a luxury home to a simple tent; the homeless will seek shelter under a bridge. In the contemporary situation shelter is generally discussed under the catch-all heading of ‘housing’. All three factors are considered essential although, of course, there may be luxury foods, luxury clothing and luxury housing, which may be seen as non-essential, but for the purpose of the following comparisons these distinctions are ignored. The figures shown are simply for the purpose of comparison––what proportion of household income is spent on these three essentials. Housing is rather special in that it is necessary to distinguish between four social groups: outright owners, mortgagees, social renters and private renters. Outright owners are excluded; apart from maintenance their outlay is nil. All groups have to pay the council tax, but social renters may get a discount (which is means tested). Bearing in mind that the average salary in 2021 was £29,600: 9
Food According to the government data for the years between 2006–18, the percentage of household income spent on food depended on the level of income. The average for all income groups was 10.95%; for the lowest 20% the expenditure was 15.89%.10 No surprises there; the poorest always pay more, as a proportion of their income, and they can only buy in small quantities, which is the most expensive way.
Warmth The website Statista provides a table showing the percentage of weekly expenditure going on clothing in the UK in 2020.11 This varies according to the income groups between 2.6% and 3.7%, the average for all groups being 3.06%.
Where heating is concerned Ovo energy state that, at the present time, the average cost of heating a home in the UK is £1042 per year, which works out at 3.5% of average income.12 Add this to the 3.06% for clothing and we get approximately 6.5% for warmth.
Shelter Housing costs are usually measured in terms of annual outlay for rental charges or mortgage repayments. Using figures from the Statista website the averages for the period 2011–2020 spent in England were: mortgagees 19%, social renters 29%, private renters 36%. Giving an overall average of 28%.13 The lower figure for social renters is due to the fact that the majority of these are on low incomes, and are more likely to be receiving housing benefits. London, as always, is an exception; Taking private renters alone, the figure for London is 46.4%, more than double that for the rest of England, at 23.1%.
If we take all these figures as indicative, we can see that the relative proportions spent on the three essentials are approximately: food 11%, warmth 6.5% and shelter 28%, giving a total of 45.5 %. This leaves approximately 54.5% that are arguably non-essential. We have to ask ourselves do these proportions make sense? Do they really reflect what we value? I would suggest that we could pay more for our clothing and food and less for our housing. Let’s be honest, clothes are cheap, thanks in large part to the sweatshops of SE Asia. A considerable amount of the clothes found in charity shops are items that have been worn once or twice, then discarded.
According to a Which report of November 2019, Britain enjoyed the lowest food prices in the world (after Singapore and the US). In the 31 years between 1988 and 2019 the cost of a typical food shopping basket had reduced by 17%.14 We waste an enormous amount of food. The food charity Fareshare reported that in the UK in 2019 ‘Over two million tonnes of the food that goes to waste each year is still edible.’ 15
Nobody wants to pay more for anything, but the issue that appears to give all but the highest income groups the most concern is that of housing. Adjectives like ‘crazy’, ‘unbelievable’ and ‘astronomical’ are commonly employed in articles discussing house prices. So perhaps we need to re-assess our priorities on the essentials, not to mention those items in the remaining 54.5%.
With an LVT system in place one could imagine people accepting a trade-off––higher food prices in return for lower house prices and rents––but this would only work domestically. Where farmers producing food for export have to sell in the international food markets, they can only do this with lower prices in order to compete with other countries, whose farm products are also subsidised. So subsidies are likely to continue into the foreseeable future, or until such time as international agreements can be reached, as happens with other trading settlements.
In considering how any land value tax might be applied to the rural situation it is necessary to recognise that the benefits of infrastructure are fewer in rural situations. Areas devoted exclusively to farming do not enjoy the same intensity of infrastructure. Items taken for granted in urban areas––street lighting, mains sewage, bus and train services, gas supplies, broadband etc––are often sparse or non-existent in rural areas.
To help the genuine farmer (as opposed to the ‘land manager’) there may well be a case for applying a reduced LVT rate to farmland devoted exclusively to food production. This would represent a transfer of the tax burden away from production onto non-productive asset wealth.
In 2009, the Irish Government commissioned a study on the feasibility of introducing a Site Value Tax (SVT), which, in the final proposal, excluded agricultural land altogether.16 It could be argued that the revenue raised from a tax on marginal agricultural land would be barely worth the administration costs, On the other hand it would seem reasonable that farmers should pay some charge for the land they use. Unfortunately the recommendations of the Irish study were not adopted, and Ireland continued with a conventional undifferentiated property tax.
References:
(1) Duncan Pickard, Lie of the Land, p.41.
(2) https://www.gov.uk/government/uploads/system/uploads/attachment_data/file/371470/ pmr_2011.pdf
(3) http://pdf.euro.savills.co.uk/uk/rural—other/uk-agricultural-land-2016.pdf
(4) http://demonstrations.wolfram.com/LocationTheoryLandUseDetermi nation/
(6) http://www.uklanddirectory.org.uk/building-land-plot-sales-london.asp
(7) Pratt, The Stewardship Economy, p.66
(8) https://uk.jobted.com/salary
(9) www.gov.uk/government/statistics/familyfood
(10) https://www.statista.com/statistics/284881/clothing-share-of- household-spending
(11) https://www.ov0energy.com/guides/energy-guides/how-much- heating-energy-do-you-think-you-use
(12) https://www.statista.com/statistics/755883/income-spent-on- mortgadge-or-rent-england
(14) https://fareshare.org.uk/what-we-do/hunger-food-waste/
(15) http://demonstrations.wolfram.com/LocationTheoryLandUseDetermi nation/
(16) Collins and Larragy, ‘A Site Value Tax for Ireland’ p. 2, Introduction https://www.researchgate.net/publication/241767601_A_Site_Value _ Tax_for_Ireland_Approach_Design_and_Implementation